Bokeh Plots
Steps To Create A New Metric
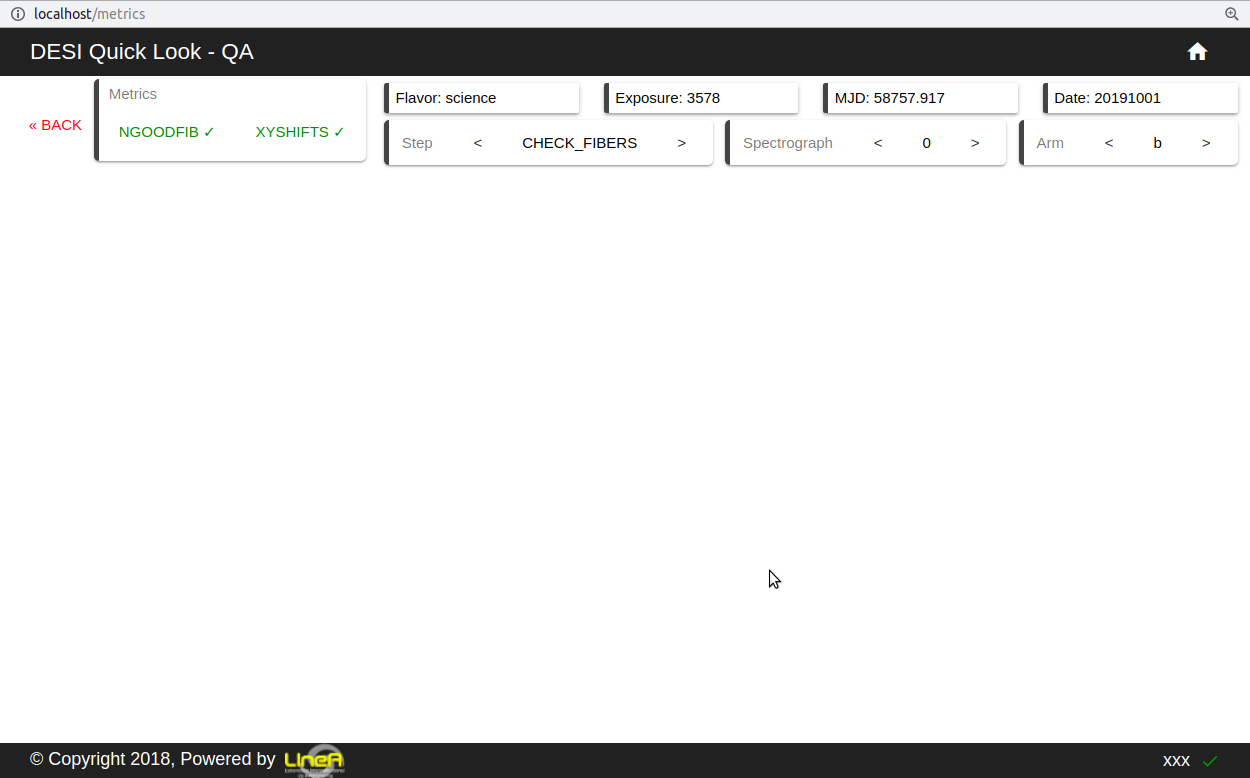
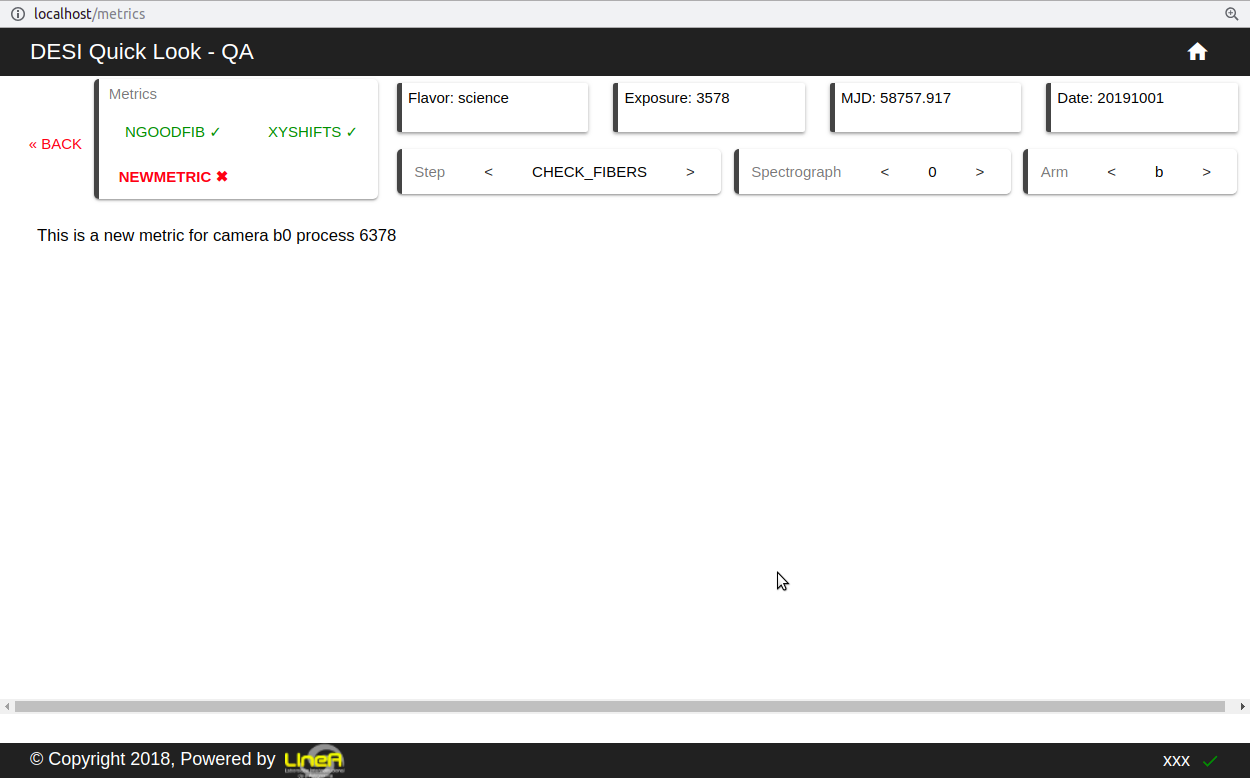
Let’s create a new metric called NEWMETRIC in CHECK FIBERS step on a science flavor exposure.
1. Create Map to Metric (Backend)
In order to understand how the plots end up in the frontend there are also 3 files divided by Flavor mapping each python QA to the appropriate frontend stage and name.
qlf
└── backend
    └── framework
        └── ql_mapping
            ├── arc.json
            ├── flat.json
            └── science.json
/qlf/backend/framework/ql_mapping/science.json
 {
 "flavor": "science",
 "step_list": [
     ...
         {
         "display_name": "CHECK FIBERS",
         "name": "CHECK_FIBERS",
         "start": "Starting to run step Flexure",
         "end": "Starting to run step ApplyFiberFlat_QP",
         "qa_list": [
             {
             "display_name": "NGOODFIB",
             "status_key": "NGOODFIB_STATUS",
             "name": "countbins"
             },
             {
             "display_name": "XYSHIFTS",
             "status_key": "XYSHIFTS_STATUS",
             "name": "xyshifts"
             },
             {
             "display_name": "NEWMETRIC",
             "status_key": "NEWMETRIC_STATUS",
             "name": "newmetric"
             }
         ]
     },
     ...
   ]
 }
The new status will be detected and ingested on the next processings when NEWMETRIC_STATUS appears at ql logs
2. Create NewMetric Folder
All QA plots are located in the same folder.
To add newmetric plots create a new folder with the following structure:
qa + name
 qlf
 └── backend
     └── framework
         └── qlf
             └── dashboard
                 └── bokeh
                     ├── qacheckarc
                     ├── qacheckflat
                     ├── qacountbins
                     ├── qacountpix
                     ├── qagetbias
                     ├── qainteg
                     ├── qaskycont
                     ├── qaskypeak
                     ├── qaskyR
                     ├── qasnr
                     ├── qaxwsigma
                     ├── qaxyshifts
                     ├── plots
                     └── qanewmetric
                         └── main.py
- Each directory has a
main.pyfile containing QA plots logic. To make new plots inside the QA they are the only place that will require changes. Plotsdiretory contains commonly used functions throughout QAs.- Changes saved will trigger a bokeh reloaded automatically if the code is correctly mapped inse the container (Map Code Inside Container).
3. NewMetric Plots Code
Now adding actual python code for each plot. More details and examples in jupyter notebooks directory.
/qlf/backend/framework/qlf/dashboard/bokeh/qanewmetric/main.py
from bokeh.layouts import column

from bokeh.models.widgets import Div

from bokeh.resources import CDN
from bokeh.embed import file_html


class NewMetric:
    def __init__(self, process_id, arm, spectrograph):
        self.selected_process_id = process_id
        self.selected_arm = arm
        self.selected_spectrograph = spectrograph

    def load_qa(self):
        cam = self.selected_arm+str(self.selected_spectrograph)

        layout = column(Div(text='This is a new metric for camera {} process {}'.format(cam, self.selected_process_id)), css_classes=["display-grid"])

        return file_html(layout, CDN, "NEWMETRIC")
4. Create Metric View
- Import the NewMetric QA class
- Add a new qa view case inside
views_bokeh.py.
/qlf/backend/framework/qlf/dashboard/views_bokeh.py
 from dashboard.bokeh.fits2png.fits2png import Fits2png
 from dashboard.bokeh.qacountpix.main import Countpix
 from dashboard.bokeh.qagetbias.main import Bias
 from dashboard.bokeh.qagetrms.main import RMS
 ...
 from dashboard.bokeh.spectra.main import Spectra
 from dashboard.bokeh.qanewmetric.main import NewMetric
 from datetime import datetime, timedelta
 ...

 def load_qa(request):
     """Generates and render qas"""
     template = loader.get_template('dashboard/qa.html')
     # Generate Image
     qa = request.GET.get('qa')
     spectrograph = request.GET.get('spectrograph')
     process_id = request.GET.get('process_id')
     arm = request.GET.get('arm')
     try:
         if qa == 'qacountpix':
             qa_html = Countpix(process_id, arm, spectrograph).load_qa()
         elif qa == 'qabias':
             qa_html = Bias(process_id, arm, spectrograph).load_qa()
         elif qa == 'qarms':
             qa_html = RMS(process_id, arm, spectrograph).load_qa()
         elif qa == 'qaxwsigma':
             qa_html = Xwsigma(process_id, arm, spectrograph).load_qa()
         ...
         elif qa == 'qahdu':
             qa_html = 'No Drill Down'
         elif qa == 'qacheckflat':
             qa_html = Flat(process_id, arm,spectrograph).load_qa() #'No Drill Down'
         elif qa == 'qacheckarc':
             qa_html = Arc(process_id, arm,spectrograph).load_qa() #'No Drill Down'
         elif qa == 'qaxyshifts':
             qa_html = Xyshifts(process_id, arm,spectrograph).load_qa()
         elif qa == 'qaskyrband':
             qa_html = SkyR(process_id, arm,spectrograph).load_qa()
         elif qa == 'qanewmetric':
             qa_html = NewMetric(process_id, arm, spectrograph).load_qa()
         else:
             qa_html = "Couldn't load QA"
     except Exception as err:
         qa_html = "Can't load QA: {}".format(err)
     ...
5. Restart Backend
The backend server restarts automatically on each save but if you can’t see the changes try (Restart Backend)
6. Create Map to Metric (Frontend)
The metrics mappping also exist in the frontend directory.
qlf
└── frontend
    └── src
        └── assets
            └── ql_mapping
                ├── arc.json
                ├── flat.json
                └── science.json
Do 1. Create Map to Metric (Backend) in the according file.
7. Rebuild Frontend
~/qlf$ docker-compose build nginx
Building nginx
...
Successfully built 22b9dc85a391
Successfully tagged qlf_nginx:latest
~/qlf$ docker-compose up
On the next exposure processed the QA will be available